
10 Fundamental Field Service KPIs & How to Track Them With FSM
Field service teams generate an enormous amount of data: job records, timestamps, parts consumption, survey responses. Almost none of it is useful until someone turns it into a small set of numbers people actually act on, otherwise known as Key Performance Indicators, or KPIs.
The usual problem is having too many field service KPIs rather than too few. Most are badly chosen, and they measure things that make a dashboard look healthy without describing the service being delivered.
The ten KPIs below are the ones field service organisations keep returning to. They fall into three groups:
- Operational: Metrics that describe how efficiently work gets done
- Customer Experience: Metrics that describe how the customer experiences that work
- Financial: Metrics that connect both the above to the money
A scorecard needs all three, because each group misleads on its own. Efficiency metrics reward speed over quality. Customer metrics tell you something is wrong without telling you where. Financial metrics arrive too late to change anything.
Raw job counts can flatter a team that isn’t really delivering. In the clip below, Allan Fairhurst shares the two KPIs he reported on instead, and why an engineer who visits eight jobs but only lands four isn’t the win the numbers suggest.
Two Vital KPIs for Building High-Performing Teams
Allan Fairhurst breaks down why ‘four installs a day’ only counts if they actually succeed, and how tracking successful completions and recovered failed activations — not just jobs attempted — is what builds a genuinely high-performing team. Watch Allan’s full episode
At a Glance: The 10 Field Service KPIs and Their Buckets
# | KPI | Bucket |
1 | First-Time Fix Rate (FTFR) | Operational / Engineer Productivity |
2 | Mean Time to Repair / Resolution (MTTR) | Operational / Engineer Productivity |
3 | Response Time (Mean Time to Respond) | Operational / Engineer Productivity |
4 | Technician Utilisation Rate | Operational / Engineer Productivity |
5 | Job Completion Rate | Operational / Engineer Productivity |
6 | Jobs per Technician per Day / Mean Time to Complete | Operational / Engineer Productivity |
7 | SLA Compliance Rate | Customer Experience |
8 | Customer Satisfaction (CSAT) | Customer Experience |
9 | Net Promoter Score (NPS) | Customer Experience |
10 | Cost per Work Order | Financial |
Operational and Engineer Productivity Field Service KPIs
1. First-Time Fix Rate (FTFR)
The percentage of jobs resolved on the first visit, with no return trip required.
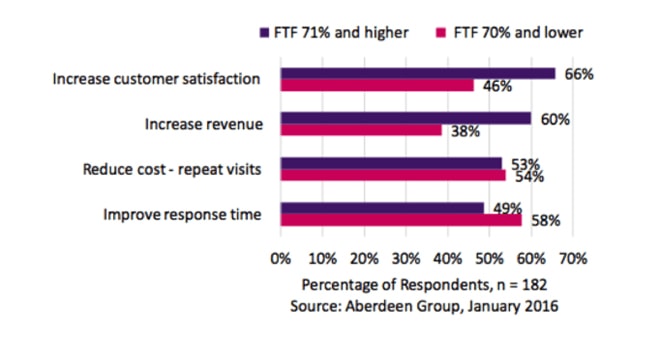
FTFR is near the top of most scorecards because it touches everything else. A first-time fix means you do not mobilise twice, pay for travel twice, interrupt the customer twice, or burn a second slot in an already tight schedule. Improve it and cost, capacity and satisfaction all move at once.
It also works better as a diagnostic than as a lever. A low first-time fix rate rarely means engineers are underperforming. More often it points upstream, to incomplete job information at triage, the wrong skill set dispatched, or a van stock policy that does not match the actual failure profile of the installed base.
Geraint Evans, Field Service Engineering Manager at B. Braun, describes training explicitly for the first-time fix, and is blunt about the alternative: the improvised repair that gets the job closed but not solved. In a regulated medical device environment, he notes, a rushed fix is simply not acceptable because of the potential to compromise safety. The same holds outside medical devices. FTFR only means something if “fixed” is defined honestly.
2. Mean Time to Repair/Resolution (MTTR)
The average time taken to resolve an issue once work begins. MTTR is the cleanest measure of how quickly your team converts a diagnosed problem into a working asset. It starts the clock at the point of intervention rather than the point of request, which isolates the repair from scheduling and travel delays. That makes it good for spotting whether technical capability, documentation or parts availability is the constraint.
Track it segmented by asset type and fault category rather than as a single blended figure. A rising average across a mixed workload tells you almost nothing. The same rise on one machine family tells you where to look.
3. Response Time (Mean Time to Respond)
How quickly a technician engages with, or arrives on site for, a request after it is logged.
Response time is often the first thing a customer notices and the first thing they complain about, which gives it outsized influence on perceived service quality even when the eventual fix is excellent. Most of what drives it sits with managers rather than engineers: scheduling logic, territory design, dispatch triage.
Engineers also tend to accept it as fair. Most field service leaders observe that response time and first-time fix rate are the metrics engineers respect most, because they reflect the effort actually put in. Metrics engineers consider a fair reflection of their work get engaged with. Metrics they consider arbitrary get gamed or resented.
4. Technician Utilisation Rate
The proportion of a technician’s paid hours spent on productive, billable work, as opposed to travel, administration and idle time.
Utilisation is the core labour efficiency indicator and the one that most directly informs capacity planning and hiring. Splitting the non-productive remainder into travel, admin and waiting is usually more actionable than the headline percentage, since each one has a different remedy.
There are two cautions tied to this Field Service KPI: First, utilisation targets pushed too high produce burnout and attrition rather than output. Second, near-total utilisation removes the slack a field operation needs to absorb emergency work, which tends to show up as SLA misses elsewhere on the scorecard.
5. Job Completion Rate
This field service KPI measures jobs closed against jobs scheduled, over a given period.
This measures how reliably the team clears the workload it has committed to. Persistent shortfalls indicate a planning problem: over-optimistic scheduling, unrealistic job durations, or an emergency load that keeps displacing planned work.
Read alongside first-time fix rate, it also flags whether “completed” jobs are genuinely finished or quietly generating return visits.
6. Jobs Per Technician Per Day/Mean Time to Complete
Throughput per engineer: how many jobs are completed in a shift, and how long an average job takes end to end.
It is the most useful capacity planning metric in the set and the most dangerous performance management one, and the difference matters.
As an aggregate planning input, throughput tells you what your operation can absorb. As an individual performance measure, it can be actively misleading, because it treats every job as equivalent when they are not. The same fault might take half an hour or an entire day, and neither figure says anything about how well it was resolved.
Use throughput at team level for forecasting, and resist converting it into an individual target without weighting for job complexity. This is the field service KPI most likely to do damage when applied bluntly, and Evans, quoted below, has the strongest objection to it.
Customer Experience Field Service KPIs
These field service KPIs describe the service as the customer receives it. They lag by nature. By the time they move, the underlying cause has already happened, which is why they need pairing with the operational group above.
Before you decide which customer-experience KPIs to track, it helps to hear what customers actually complain about. In the clip below, Allan Fairhurst ranks the three things they care about most, drawn from years of handling installs and the issues that follow them.
Top 3 Customer Delivery Demands In Field Service
Allan Fairhurst puts customer demands in the order he saw them play out: quality first (don’t drill the wrong hole or hit a pipe), then speed, then the communication that matters most when an install fails and someone’s waiting to hear when you’re coming back. Watch Allan’s full episode
7. SLA Compliance Rate
The percentage of jobs meeting the response and resolution targets set out in the service contract.
Where contracts carry penalty clauses, this is the metric with direct commercial consequences, and it is usually the first number a customer raises in a review meeting. Report it broken down by contract and by SLA tier rather than as a single blended figure, since one demanding contract can mask good performance everywhere else, or hide a failing one.
It sits in the customer bucket even though response time, scheduling and first-time fix drive almost all of it. This is the point where operational performance turns into a contractual obligation.
Hitting SLAs often comes down to diagnosing a fault correctly the first time. In the clip below, Debbie Vaughn explains where AI is starting to help field teams do exactly that, while keeping a human in the loop.
AI’s exciting impact on SLAs
Debbie Vaughn is excited about AI for predictive failure analysis and sharper alerting — a better diagnosis so engineers don’t roll a truck with the wrong parts. Watch Debbie’s full episode
8. Customer Satisfaction (CSAT)
A post-visit score capturing how satisfied the customer was with the service delivered.
CSAT is the primary experience metric because it is job-specific and immediate. Its value depends heavily on collection discipline: ask soon after the visit, keep it short, and make sure it can be traced back to the individual work order so that low scores can be investigated rather than merely counted.
The free-text comment attached to a CSAT response is often worth more than the score. It is where you find out that the fix was fine, but nobody told the customer the engineer was running late.
9. Net Promoter Score (NPS)
A measure of longer-term loyalty and willingness to recommend, typically collected on a relationship rather than per-visit basis.
CSAT tells you about a job. NPS tells you about the relationship. It is the slower indicator that individual satisfaction scores eventually feed into, and its main use is trend detection over quarters rather than reaction over weeks. It is most informative when read against contract renewal and churn data.
Financial Field Service KPIs
10. Cost Per Work Order
The full cost of delivering a single service call, including labour, travel, parts and any subcontracted work.
Cost per work order is how field activity gets expressed in terms the rest of the business recognises. It also validates improvement work elsewhere on the scorecard. A rise in first-time fix rate or a reduction in travel time should be visible here, and if it is not, the improvement may be less real than it appears.
Segment it by job type, contract and region. A blended average across planned maintenance and emergency callouts is too coarse to act on, since the two have entirely different cost structures.
One note on this bucket. With a single metric, it is the thinnest of the three, which reflects how most field service scorecards are actually built rather than how they ideally should be. Teams wanting a fuller financial picture typically extend it with revenue per technician, profit per job, and the mix of billable versus warranty or contract work.
Track & Report On Your Field Service KPIs With FSM Software
Compare Field Service Management Software tools that meet your data capturing and KPI tracking requirements.
What Type of Field Jobs Do You Do?
Where Field Service KPIs Stop Telling the Truth
Every field service KPI above is worth tracking. But a scorecard only ever approximates the work, and most field service measurement goes wrong in the gap between the two. Metrics that look rigorous on a dashboard can quietly misdescribe what happened in the field, and when performance management is built on top of that misdescription, the consequences land on the engineers.
Geraint Evans, Field Service Engineering Manager at B. Braun, leads a team of 25 engineers maintaining dialysis and infusion equipment, largely for NHS trusts. Speaking on the Comparesoft Field Service Management Podcast, he made a case for looking past the numbers that is worth setting alongside the list above, less as an argument against KPIs than as a warning about which ones deserve weight.
There’s an Engineer Behind Every KPI
Geraint Evans warns that when field service performance is reduced to numbers alone, engineers start to feel like just another cog. He explains why fair measurement has to account for travel time, job complexity and work-life balance, and how ignoring that leads to burnout, flight risk and a reactive spiral. Watch Geraint’s full episode
The Problem With Blanket Metrics
The metric Evans pushes back on hardest is the simplest one: job count.
“If you look at a blanket metric like how many jobs have you done today… it ignores the complexity, because we’re dealing with some quite complicated bits. It could be a 30-minute fix or an all-day fix.”
The complaint is not that throughput cannot be measured. A raw count treats every job as interchangeable, and in his work they never are. Two engineers with identical daily numbers may have had completely different days, and the metric cannot tell you which one did the harder work.
The same applies to everything a count leaves out. Blanket metrics, as he puts it, don’t factor in the variables, and in field service the variables are substantial. Travel time, site access, waiting for a machine to come out of use, a fault that turns out to be three faults. None of that appears in a job count, but all of it consumes the day.
Measure Impact Over Count
His alternative is a reframe rather than a replacement metric. Instead of asking an engineer how many devices they fixed, he asks: “What impact have you had today?”
It is a small change in phrasing that surfaces very different information. A count invites a defensive answer. Asked about impact, an engineer will describe the job that took all day because it was genuinely difficult, or the intervention that stopped a machine failing next month. Evans is explicit that this is not anti-data, but that in his industry the motivation comes from the outcome rather than from, in his phrase, sitting green on a dashboard.
Which Metrics Field Service Engineers Actually Respect
Not all KPIs land the same way with the people being measured. Evans finds that first-time fix rate and response time are the ones his engineers respect, because those metrics reflect the effort they actually put in. Job counts are the ones that generate resentment, for the reasons above.
That distinction is practically useful. A metric engineers consider a fair reflection of their work gets engaged with and improved. A metric they consider arbitrary gets gamed, or quietly ignored, or becomes a reason to leave.
What Good Measurement Looks Like Instead
Evans’s answer is more context around the metrics rather than fewer of them. Three things stand out.
The first is fairness in scheduling. Where managers have direct control is in how work is allocated. Giving engineers a voice in scheduling, and acknowledging openly when a period is genuinely hard, does more for sustained performance than tightening a target.
The second is autonomy. He identifies lack of it as the primary driver of burnout in field service, and puts the effect as a chain: “If an engineer feels trusted, then they feel empowered and then they feel engaged.” Measurement regimes that signal distrust break that chain at the first link.
The third is knowing the individual baseline. Evans describes himself as not a manager of 25 engineers but “25 different managers to 25 individuals.” The early warning sign he watches for is not a number falling but a person changing: someone whose output is still fine but who has stopped contributing ideas or engaging in meetings. No dashboard reports that.
Why It’s Essential to Set and Track Field Service KPIs
KPIs are metrics used to track the progress of your field service operations and understand how well or how poorly your team is performing over time, which is key for understanding and creating workforce optimisation strategies. KPIs can be set up to monitor employee performance, project progress and success, or to monitor a company’s overarching corporate goals. Without them, it’s difficult to determine if your field service processes are effective.
KPIs aren’t just a measuring tool, they work to drive behaviour too. Each key performance indicator helps to identify problem areas within an operation so that improvements can be made. Whether they’re simple or complex. The average number of KPIs measured by field service companies is between four and seven.
Setting realistic yet progressive goals for your field service staff and using KPIs to measure their performance allows you to:
- Monitor operations
- Provide improved service
- Enhance technician productivity
- Drive business revenue
KPIs are crucial for a mobile workforce, not just from a management point of view but also for workers. Individuals can be fairly judged and assessed based on their performance and receive recognition for their achievements.
How KPIs Support Service Delivery Goals
KPIs are an essential navigational instrument for field service companies. But they can only deliver mission-critical data if you choose the right ones – those that really matter to your business.
Used effectively, KPIs can increase productivity, improve customer service, and boost profits. They can also indirectly improve employee and customer retention. When setting your KPIs, consider your company’s overarching corporate strategy and what needs to be achieved.
Once you’ve set up your KPIs, inform your workforce about the metrics you’re going to use for monitoring performance. You can access performance data via your FSM system and use it to inform strategic decision-making going forwards.
How Field Service Management Software Can Help Set and Track Core KPIs
Planning your KPIs is one thing and setting them in another. But keeping track of them can be challenging, especially if you haven’t got access to an automated tool with data insight functionality.
Using manual methods such as spreadsheets and whiteboards can be both time-consuming and error-prone, potentially causing friction between staff if numbers don’t match up. That’s where Field Service Management Software comes in handy.
Not only does an FSM system compile the tools needed to plan, schedule, and track your field workers, but it can also easily capture and record data. This helps to:
- Display data in an easily digestible format
- Quickly capture and analyse data relating to your KPIs
- Easily connect data to form patterns
- Make informed decisions on deep data insights